
Figure 2. Mean (± s.e.m.) time courses of the I-wave facilitation evaluated with surface EMG recordings.
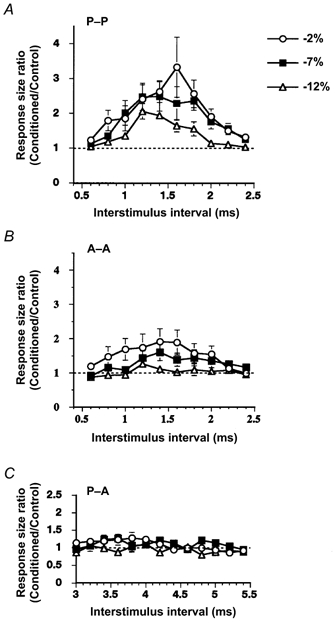
Abscissae indicate the ISIs, and ordinates the mean size ratios for all the subjects. Three time courses for different intensities of S2 (2, 7 and 12 % below the active threshold: −2, −7 and −12 %) are shown. A, S1 and S2 were magnetic stimuli inducing posteriorly directed currents in order to elicit preferentially I3-waves. At ISIs of 1.2–1.8 ms, the facilitatory effect was evoked with a conditioning stimulus of any intensity (P < 0.02). The stronger the conditioning stimulus (S2), the greater the facilitation. B, S1 and S2 were magnetic stimuli inducing anteriorly directed currents eliciting I1-waves. The facilitatory effect was evoked at ISIs of 1.4 and 1.6 ms when the intensity of the conditioning stimulus was fixed at 2 or 7 % below the threshold (P < 0.02). No facilitation was evoked with a conditioning stimulus set at 12 % below the active threshold. C, S1 was posteriorly directed and S2 anteriorly directed. Slight facilitation was evoked at ISIs of 3.6–4.0 ms by the conditioning stimulus at an intensity of 2 and 7 % below the threshold. The peak of facilitation appeared to be smoothed out because the best ISI for facilitation was different from subject to subject.