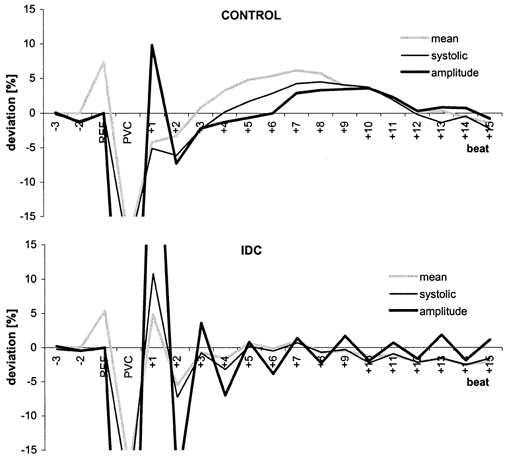
Figure 2. Postextrasystolic BP regulation patterns (mean deviation from reference for each group) for the control (top) and IDC (bottom) groups.

Beat−1 is the reference (REF) for systolic BP (thin black line) and BP amplitude (thick black line) and beat−2 is the reference for mean BP (grey line).
