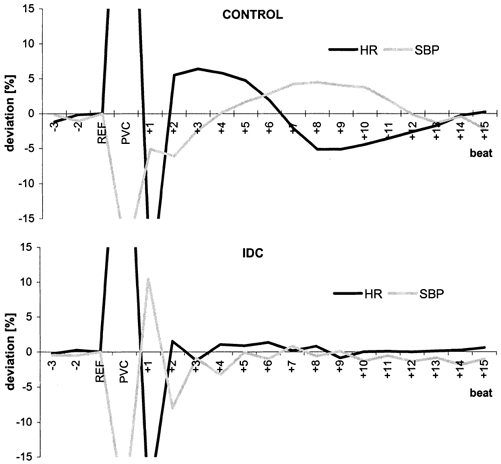
Figure 4. Postextrasystolic regulation patterns (mean deviation from reference for each group) of the systolic BP (SBP, grey line) and the heart rate (HR, black line) in controls (top) and IDC patients (bottom).

In controls, a typical baroreflex response was apparent, whereas in IDC patients, the baroreflex response was abolished due to the pronounced postextrasystolic potentiation (PESP).
