
Figure 1. Correction for potentiation by .
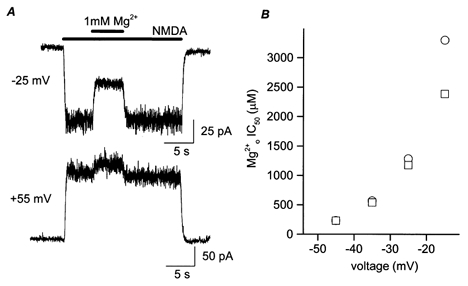
A, example of a cell in which the NMDA-activated current was potentiated by . Bars above the traces indicate times of agonist and application. At −25 mV, the inward current was inhibited by 1 mm ; at +55 mV, 1 mm potentiated the outward current. B, calculated IC50 values before (○) and after (□) correction for potentiation are plotted here for comparison. At depolarized voltages, where IC50 reaches the millimolar range, potentiation leads to overestimation of IC50 values and exaggeration of the voltage dependence of inhibition.