
Figure 2. Transverse MRI sections.
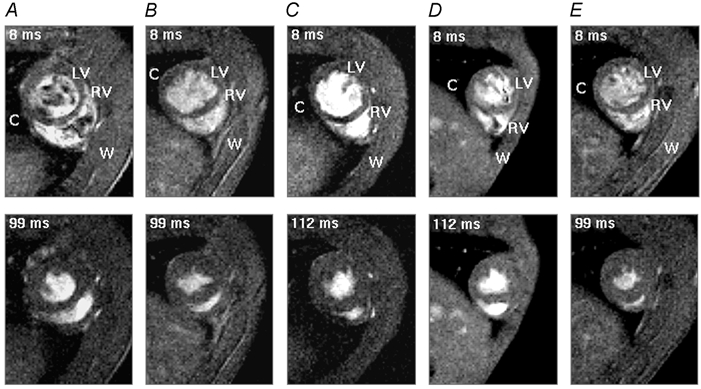
Typical transverse sections obtained in end-diastole (upper panel) and end-systole (lower panel) from the heart of a normal control rat (A), rats diabetic from 13 weeks (disease duration 3 weeks, B), 10 weeks (disease duration 6 weeks, C), 7 weeks (disease duration 9 weeks, D) and a captopril-treated rat diabetic from 7 weeks (disease duration 9 weeks, E). All rats were scanned when they were 16 weeks old. The body weight of the normal rat was 340 g and body weights of the rats diabetic from 7, 10 and 13 weeks and the captopril-treated rat were 230, 275, 330 and 245 g, respectively. The heart rate was continuously monitored throughout the imaging session giving an intrinsic heart rate of 315 ± 4 beats min−1 for the control rat and 290 ± 4, 300 ± 6, 307 ± 4 and 300 ± 4 beats min−1 for the four diabetic rats, respectively. The time points at which these images were taken are indicated in the upper left-hand corner of each panel and correspond to the delay after the trigger, taken from the R wave of the electrocardiogram (ECG), at which the signal was acquired. Each image is the average of two signals obtained at corresponding points in the cardiac cycle following the R wave. LV and RV indicate left and right ventricles, respectively, and C and W indicate chest cavity and chest wall, respectively. Slice thickness was 1.50 mm for the normal control rat and 1.44 mm for the four diabetic rats. Field of view (FOV) was 5 cm for the normal control rat and 4.5 cm for the four diabetic rats. With an image matrix of 128 × 128 pixels, the nominal in-plane resolution was approximately 351.6–390.6 μm pixel−1. The effective repeat time (TR) was approximately 13 ms and the echo time (TE) was 4.3 ms.