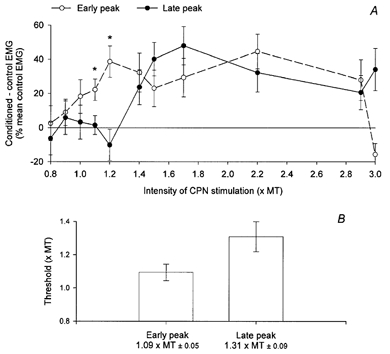
Figure 4. Threshold of the early and late facilitations induced in Q EMG during walking.

A, the difference (expressed as a percentage of the mean control EMG) between the area of the conditioned EMG by the CPN stimulation during walking (15 ms after heel strike) and the control EMG (50 trials of each) is plotted against the intensity of the CPN stimulation (× MT). ○, the amount of facilitation extracted from the area of the early peak, and • that from the late peak. Vertical bars are ±s.e.m. * Significant differences between the amplitude of the early and late peaks. B, the amplitude of the vertical columns represents the mean threshold (ordinate is the intensity of the CPN stimulation × MT) of the early (left) and of the late (right) peaks (±s.e.m.). The value (±s.e.m.) of the mean threshold for both peaks is written below each of the corresponding columns.
