
Figure 7. Effect of valinomycin, 1-EBIO and changes in [K+]o on membrane potential (Vm).
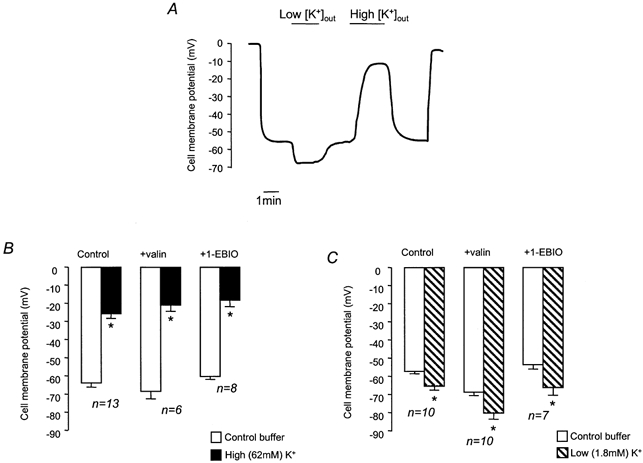
A, representative trace showing the effect of high and low [K+]o on Vm. B, effect of high [K+]o on mean Vm (control), in the presence of valinomycin (+valin, 5 μm), and in the presence of 1-EBIO (+1-EBIO, 1 mm). C, effect of low [K+]o on mean Vm (Control), in the presence of valinomycin (+valin), and in the presence of 1-EBIO (+1-EBIO). * Significant difference from Vm in control buffer (Student's paired t test, P < 0.05).