
Figure 3. Effect of CSP on the time course of the Ca2+ current.
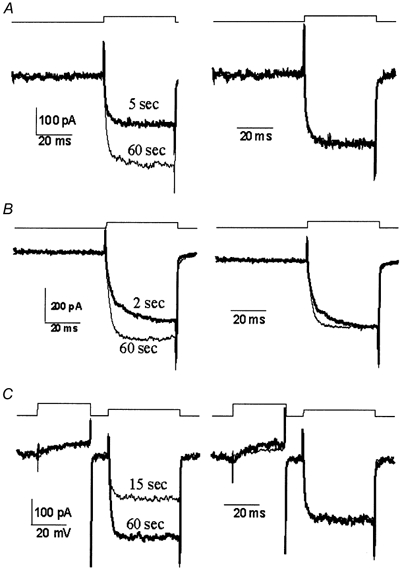
Recordings are from three calyces (A-C) before (thick line) and after (thin line) perfusion through the patch electrode with CSP with voltage protocols above each panel. Raw (leak subtracted) data are shown in the left panel to compare current amplitudes while traces normalized to the current amplitude at the end of the step are on the right to compare current pulse shape. A and B are with a single pulse protocol depolarizing from −80 to 0 mV for 40 ms. In C the test pulse was preceded by a strong (+80 mV, 30 ms) prepulse to remove any voltage-sensitive inhibition.