
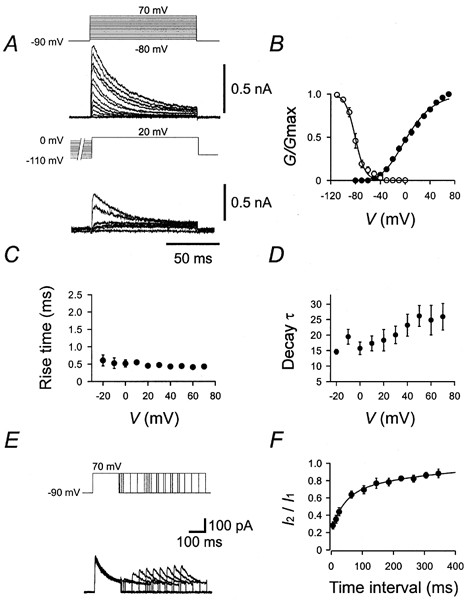
Figure 7. Gating properties of the A-type K+ current component.
A, traces of K+ current in the presence of 20 mm external TEA. Pulse protocols (identical to those used in Fig. 5) are shown above the traces. B, activation curve (•, n = 10) and steady-state inactivation curve (○, n = 7). C, 20–80 % rise time, plotted against test pulse potential (n = 10). D, decay τ, plotted against test pulse potential (n = 10). The decay phase of the current during a 100 ms pulse was fitted with the sum of a single exponential function and a constant. E, traces of K+ currents in the presence of 20 mm external TEA. Pulse protocol: holding potential −90 mV, 150 ms pulse to +70 mV (conditioning pulse), pulse of variable duration to −90 mV, 150 ms pulse to +70 mV (test pulse), and step back to −90 mV. Pulse protocol is shown above the traces. F, time course of recovery from inactivation (n = 6). The amplitude of the peak current evoked by the test pulse (I2) divided by that evoked by the conditioning pulse (I1) was plotted against the interpulse interval. Data points were fitted with the sum of two exponentials. For curve parameters see Table 1.