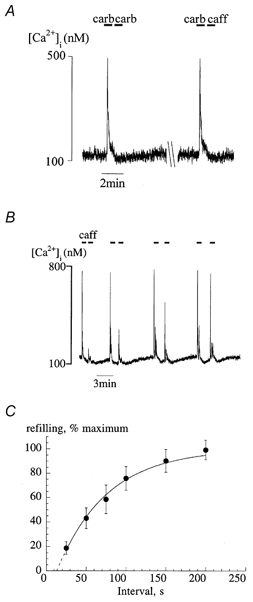
Figure 2. Depletion and the time course of restoration of intracellular Ca2+ stores.

A, exposure to two applications of carbachol (20 μm) in rapid succession (left) or carbachol followed by caffeine (20 mm; right). Exposure periods are shown by the horizontal bars. B, paired exposures to caffeine (20 mm) at different intervals as indicated by the horiontal bars. C, plot of the recovery of the caffeine transient as a function of interval (t) between paired exposures. The data are plotted as a percentage of the second vs. first Ca2+ transient magnitude (% recovery) for each pair. Values are means ± s.e.m., n = 7. The line is a least-squares fit using the equation: %Recovery = 100(1 – exp(-(t–t0)/τ)). τ is the time constant of the curve; the curve has been extrapolated to intersect the abscissa at t0.
