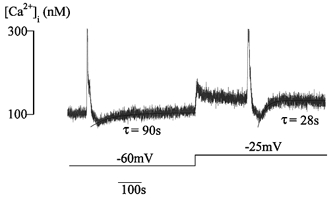
Figure 8. Recovery of caffeine-induced Ca2+ transient undershoot at different membrane potentials.

Time course of recovery of [Ca2+]i from the undershoot following caffeine-induced [Ca2+]i release. Curves are the least-squares fit through the data points with a single exponential equation: A=A0 (1 – exp(- (t–t0)/τ)). The time course was measured at a holding potential of −60 mV and −25 mV under voltage clamp.
