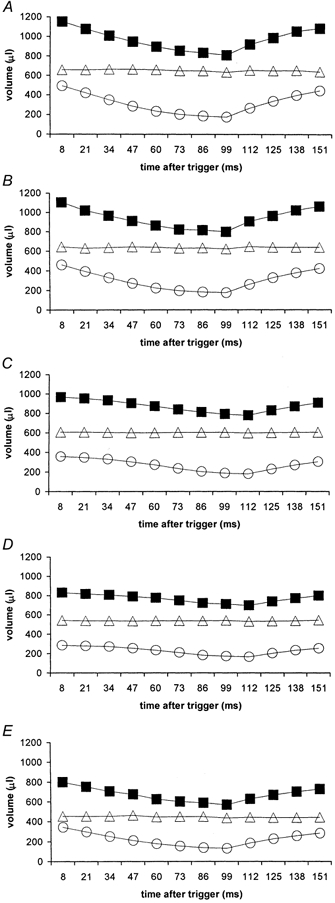
Figure 2. Epi- (squares), endo- (circles) and myocardial (triangles) left ventricular (LV) volume curves.

Epi-, endo- and myocardial left ventricular (LV) volume curves obtained from the transverse MRI images of the control group (A), and rats diabetic from 13 (B; n = 4), 10 (C; n = 4) and 7 weeks (D; n = 4), and the captopril-treated diabetic group (E; n = 4 rats) (disease durations 3, 6, 9 and 9 weeks, respectively). All the experimental animals were male Wistar rats aged 16 weeks at the time of scanning. The average body weight of the control group (n = 4 in each case) was 351.3 ± 9.7 g and those of the four diabetic groups were 235 ± 8.4, 282.5 ± 6.6, 335 ± 8.4 and 247.5 ± 15.5 g, respectively. The heart rate was continuously monitored throughout the imaging session giving average intrinsic heart rates of 322 ± 9 beats min−1 for the control rats and 280 ± 6, 280 ± 7, 318 ± 7, and 311 ± 10 beats min−1 for respective diabetic groups.
