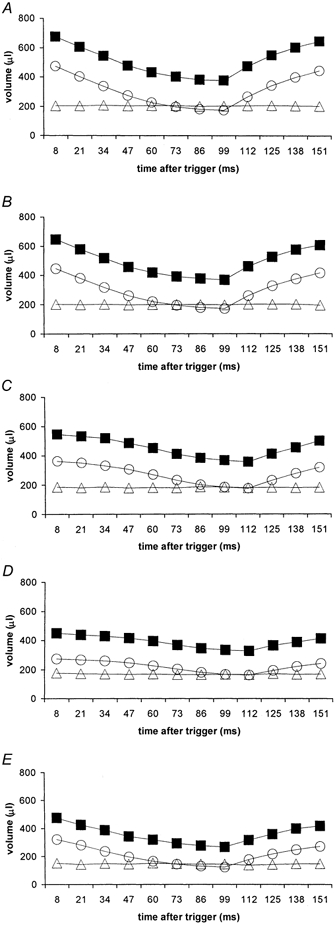
Figure 3. Epi- (squares), endo- (circles), and myocardial (triangles) right ventricular (RV) volume curves.

Epi-, endo- and myocardial right ventricular (RV) volume curves obtained from the transverse MRI images of the control group (A), and rats diabetic from 13 (B), 10 (C) and 7 weeks (D), and the captopril-treated diabetic group (E) (disease durations 3, 6, 9 and 9 weeks, respectively). Experimental details as summarized in the legend to Fig. 2.
