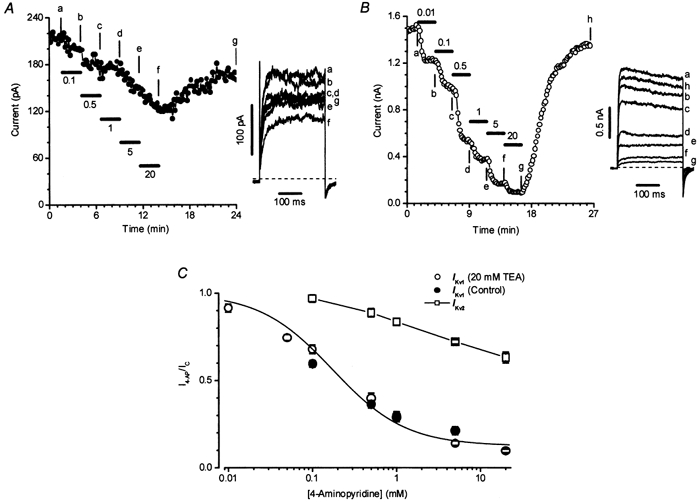
Figure 3. Inhibition of Ikv by 4-aminopyridine in rat conduit PAMs.

A and B, the effect of various concentrations of 4-AP (indicated in mm) on Ikv2 and Ikv1 in two representative cells, respectively, using the experimental protocol described in the legend to Fig. 2A. Insets show current traces at times indicated by the letters. Cm was 12.7 (A) and 12 pF (B). C, concentration dependence of the block of Ikv1 (circles) and Ikv2 (squares) by 4-AP. The continuous line through the circles is drawn according to the equation described in the legend to Fig. 2B with an IC50 of 0.17 mm and a residual component A equal to 0.12. Open (n = 11) and filled (n = 6) circles show normalized current in the presence and absence of 20 mm TEA, respectively. The line through the squares (n = 6) is drawn by eye. I4-AP/IC represents a ratio of the current in the presence of the corresponding concentration of 4-AP (I4-AP) and control current (IC) in the absence of the inhibitor.
