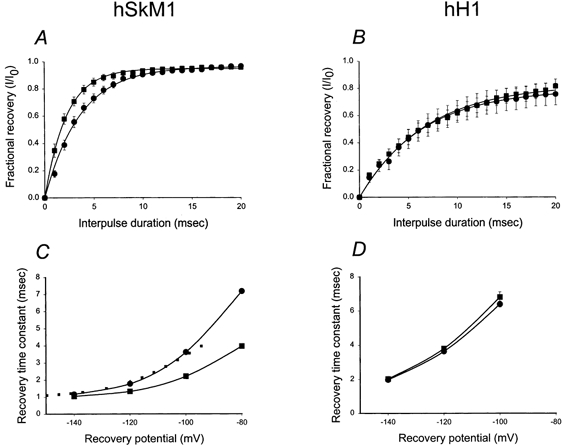
Figure 6. hSkM1 recovery from inactivation is faster under conditions of reduced sialylation; hH1 recovery rate remains constant.

A and B, recovery from inactivation at a −100 mV recovery potential. Data represent the average fractional current ± s.e.m. measured following a −100 mV recovery potential of varied duration, ranging from 1 to 20 ms. Curves are fits of the data to single exponential functions. A, hSkM1. •, expressed in Pro5 cells (n = 9); ▪, expressed in Lec2 cells (n = 9). B, hH1. •, expressed in Pro5 cells (n = 10); ▪, expressed in Lec2 cells (n = 8). C and D, potential dependence of recovery time. Data are τrec measured at different recovery potentials. C, hSkM1. •, expressed in Pro5 cells (n = 9); ▪, expressed in Lec2 cells (n = 9). Dotted line represents the Lec2 data shifted by 14.5 mV in the hyperpolarized direction along the voltage axis. D, hH1. •, expressed in Pro5 cells (n = 10); ▪, expressed in Lec2 cells (n = 8).
