
Figure 3. Distribution of cutaneous mechanoreceptors in the foot sole.
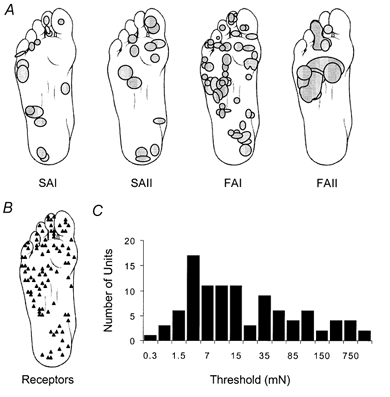
A, the receptive field for each receptor type in the foot sole is illustrated. The receptive field was outlined with a monofilament 4–5 times greater than the initial threshold value. B, the approximate position of the afferent unit in the foot sole for all receptor types is depicted. C, distribution of the total number of documented receptors and the accompanying threshold levels per unit in the foot sole (n = 104).