
Figure 5. Effect of ‘blind separation’ on frequency domain analysis.
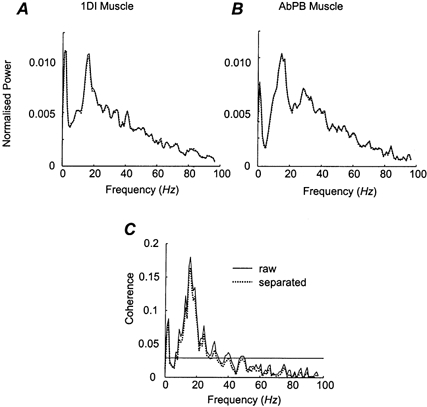
Spectral domain analysis from the 1DI and AbPB EMG from a healthy single subject calculated across the entire task, a period of ∼510 s. A, normalised power spectra of the rectified 1DI EMG, calculated from the raw data (continuous line) and separated data (dotted line). B, normalised power spectra of the rectified AbPB muscle, calculated from the raw data (continuous line) and separated data (dotted line). C, coherence spectra between the rectified 1DI-AbPB muscle pair, calculated from the raw data (continuous line) and separated data (dotted line). The horizontal continuous line indicates the 95 % significance level (P < 0.05).