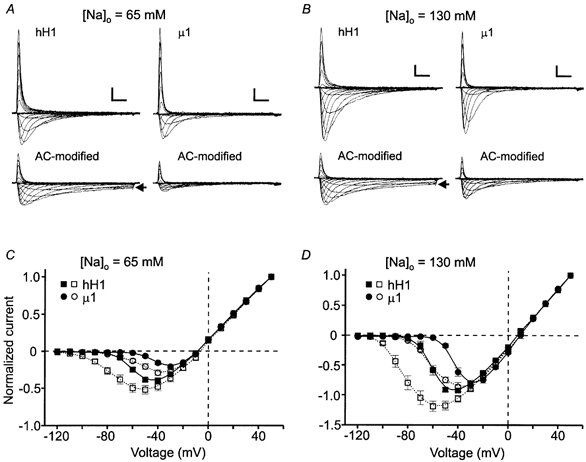
Figure 3. Current-voltage relationships of hH1 and μ1 channels in solutions containing external sodium.

The channels were modified as described in Fig. 2. A and B, representative hH1 (left) and μ1 (right) currents recorded from cells bathed in 65 (A) or 130 mm (B) external sodium solution. Note the sustained inward hH1 currents after AC modification (arrows in A and B). Scale in A and B, 1 nA, 2 ms. C, normalized current-voltage relationships of hH1 (▪, □) and μ1 (•, ○) channels recorded in external solution containing 65 mm sodium before (filled symbols; hH1, n = 8; μ1, n = 6) and after (open symbols; hH1, n = 7; μ1, n = 5) AC modification. D, normalized current-voltage relationships of hH1 (▪, □) and μ1 (•, ○) channels recorded in external solution containing 130 mm sodium before (filled symbols; hH1, n = 8; μ1, n = 6) and after (open symbols; hH1, n = 8; μ1, n = 6) AC modification. The data for each cell were normalized according to the peak current amplitude at +50 mV. Compared with the control data, AC modification shifted the voltage dependence of current activation by −25 to −30 mV.
