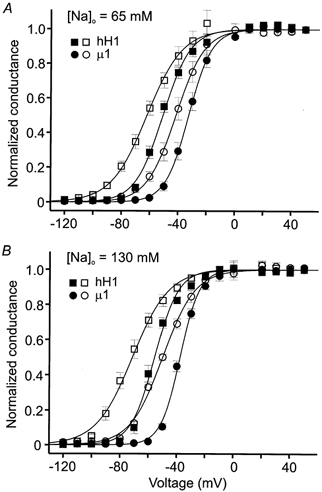
Figure 4. Normalized conductance-voltage relationships in external solutions containing 65 (A) or 130 mm (B) sodium before (filled symbols) and after (open symbols) channel modification by 100 μm AC.

Conductance (gm) measurement and subsequent fit with an empirical Boltzmann function are described in Methods. A, normalized membrane conductance of hH1 (▪, □) and μ1 (•, ○) channels in 65 mm external sodium solution. B, normalized membrane conductance in 130 mm external sodium solution. Data in A and B are from the same cells used to plot the current-voltage relationships in Fig. 3. The midpoint voltages (V0.5), slope factors (k) of the fitted Boltzmann function, and number of cells (n) for each data set are listed in Table 1.
