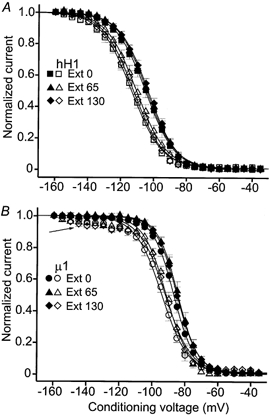
Figure 5. Normalized steady-state inactivation of hH1 (A) and μ1 (B) channels before (filled symbols) and after (open symbols) channel modification by 100 μm aconitine.

The pulse protocol for determination of steady-state availability and the Boltzmann equation used to fit the data are described in Methods. A, steady-state inactivation of hH1 channels in 0 mm (▪, □), 65 mm (▴, ▵) and 130 mm (♦, ⋄) external sodium solution. B, steady-state inactivation of μ1 channels in 0 mm (•, ○), 65 mm (▴, ▵) and 130 mm (♦, ⋄) external sodium solution. Note the small amount of reduced availability of AC-modified μ1 channels after conditioning pulses ranging from −140 to −120 mV (arrow). The maximum value of available current in the fitted Boltzmann function was not adjusted to reflect the small reduction in current availability in the negative voltage range. The midpoint voltages (V0.5), slope factors (k) of the fitted Boltzmann function and number of cells (n) for each data set in A and B are listed in Table 2.
