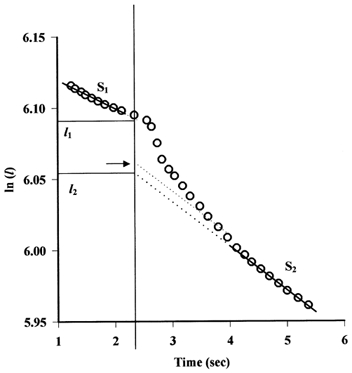
Figure 2. Estimation of changes in vessel radius following a step increase in pressure.

In this experiment, a marker red cell was followed before and after a step increase in pressure from 57 to 71 cmH2O. The logarithm of the distance of the red cell from the occlusion site, l, decreases linearly with time until the step increase in pressure (indicated by the vertical line at t = 2.34 s), when l drops from one linear relation of slope S1 (-0.021) to a second linear relation of slope S2 (-0.031). Extrapolation of S1 to the time at which pressure was increased yields a value l1 and backward extrapolation of the second slope to the same time yields the value l2. If r1, the vessel radius prior to the increase in pressure is known, r2, the new equilibrium value of vessel radius after pressure has been increased, can be calculated from l1 and l2 (equation (4)). Also illustrated is the estimation of an intermediate length (using S2) from which an intermediate value of r can be calculated (horizontal arrow).
