
Figure 3. The effects of step and steady increases in pressure on PB at different rates of increase in pressure.
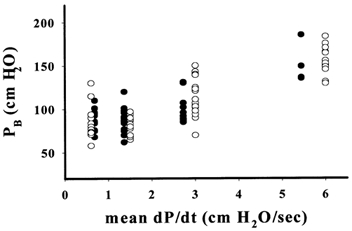
Values for PB observed when pressure was increased stepwise (•) are plotted against the mean rate of increase in pressure (dP/dt) and compared with values of PB when dP/dt was achieved as a steady ramp (○). There was no significant difference between values of PB at similar mean values of dP/dt, but mean PB was significantly increased at the two higher levels of dP/dt (n≥ 5, P < 0.05).