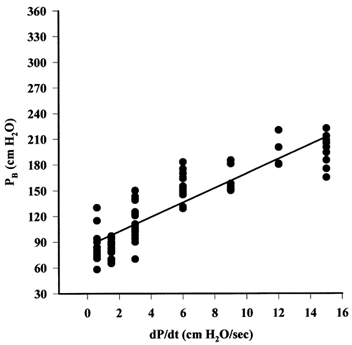
Figure 4. Relationship between PB and dP/dt.

The increase in PB with the rate of increase in pressure for measurements made between 12 and 20 °C is shown. Each point represents a measurement from one vessel (for each value of dP/dt, n > 4). The continuous line is the regression line through the points. PB0 (the intercept) for these data is 85.46 cmH2O. These observations are consistent with the latent period theory where the slope of the regression line is interpreted as the latent period, T.
