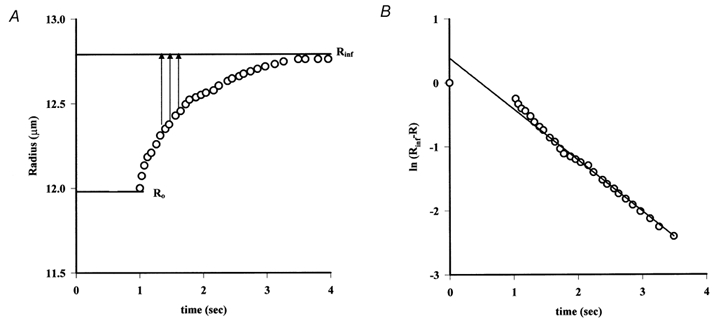
Figure 6. Evaluating the changes in visco-elasticity.

A, the changes in capillary radius, calculated from the movements of a marker red cell, after a step increase in pressure from 57 to 71 cmH2O are plotted against time (progression of the same cell in Fig. 2). The radius increases approximately exponentially with time from an initial radius R0 to a final radius, Rinf. B, semi-logarithmic plot of the changes in vessel radius against time (same data as in A) is linear. The slope of the relationship is the reciprocal of the time constant τ.
