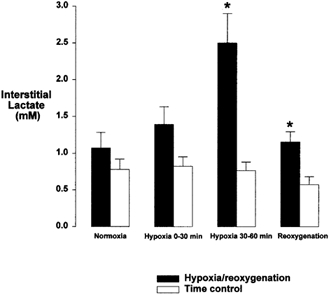
Figure 4. Interstitial lactate concentrations during normoxia, hypoxia and reoxygenation.

Bar graph showing interstitial lactate concentrations during normoxia, hypoxia and reoxygenation. Normoxia, hypoxia and reoxygenation (▪; n = 11–15) and time control experiments (□; n = 8–11). * Significantly different from time control; P < 0.01.
