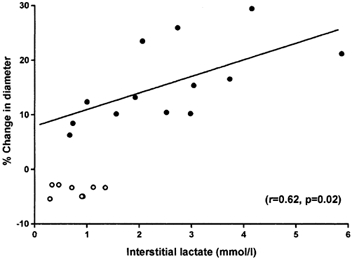
Figure 5. Correlation between coronary artery diameter and interstitial lactate concentration.

Correlation between percentage change in coronary artery diameter (baseline = 0 %) and interstitial lactate concentration. Each circle represents a separate vessel. •, lactate values from microdialysis sampling in the arteries from 30–60 min of hypoxia and steady state values of diameter after 60 min of hypoxia (r = 0.62; P = 0.02). ○, time controls.
