
Figure 1. Distribution of NADH fluorescence and oscillations of NADH fluorescence triggered by cholecystokinin (CCK).
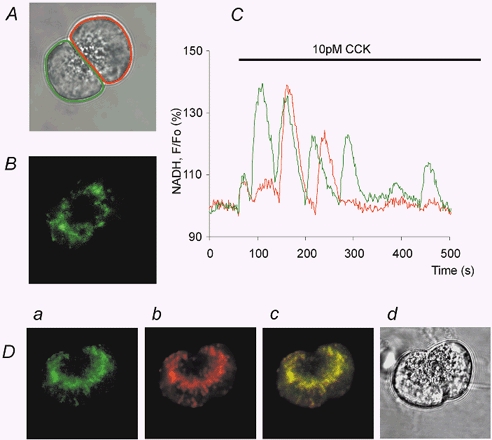
A, transmitted light image showing the structure of the acinar doublet under investigation, with the two areas of interest identified by the different colours (around the cells). B, distribution of NADH autofluorescense in the same acinar doublet. C, oscillation of NADH autofluorescence recorded in the individual cells (from the regions of interest specified in A). D, distribution of NADH autofluorescence (Da) and Mito Tracker Red fluorescence (Db) in the two cells. Dc shows the overlay image of Da and Db. A transmitted light image of this doublet is shown in Dd.