
Figure 1. The lipo-oxygenase inhibitor NDGA interferes with the activity of ICRAC.
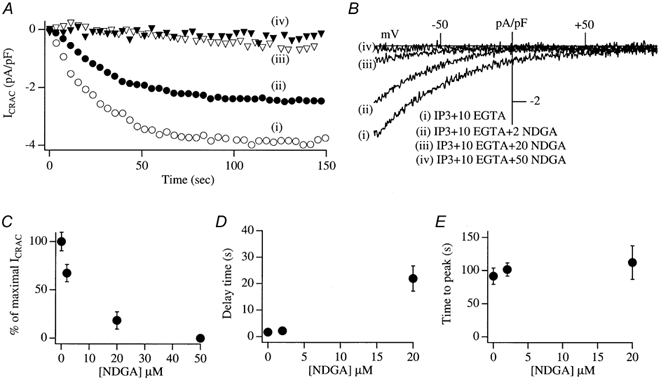
A, the development of ICRAC (measured at −80 mV from the voltage ramps) in control conditions (trace i, open circles) and then following pre-incubation (> 15 min) with different concentrations of NDGA. B, I–V relationships taken when the currents had reached steady state (80–100 s). Stores were emptied by dialysis with InsP3+ 10 mm EGTA. C, the relationship between the concentration of NDGA and inhibition of ICRAC is shown. D, the delay before ICRAC activates versus concentration of NDGA. E, time to peak versus NDGA concentration. In this, and all subsequent figures, the data points are means ± s.e.m.