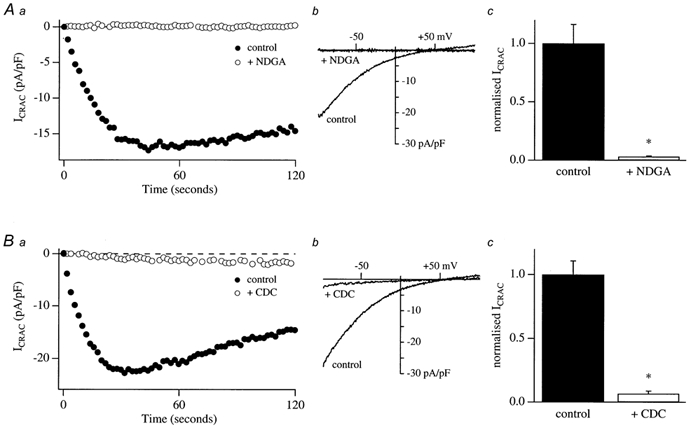
Figure 8. Pretreatment with either NDGA or CDC suppresses the Na+ current through CRAC channels in divalent ion-free external solution.

Aa, comparison of the time course of the monovalent Na+ current for a control cell and that for a cell which had been pre-incubated with 20 μm NDGA for around 15 min. b, the ramp I–V relationships are shown for the cells in a, taken at 60 s for both conditions. c, mean data from four control cells and four cells pre-exposed to NDGA. Ba, time course of a control cell and a cell pre-incubated with 20 μm CDC. b, corresponding ramp I–V. c, mean data from four control cells and four cells pre-exposed to CDC prior to break-in. Data have been normalized to the amplitude of the controls.
