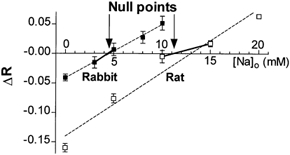
Figure 3. Summary of null-point results.

Average changes in SBFI ratio vs.[Na+]o(n≥ 10 for each point). Considering only the first points above and below the null point (arrows), resting [Na+]i was found to be 4.4 mm for rabbit and 11.2 mm for rat ventricle. The dotted line shows linear regressions for all the points for rabbit and rat (the overall regression would give resting [Na+]i of 4.5 mm for rabbit and 13.4 mm for rat).
