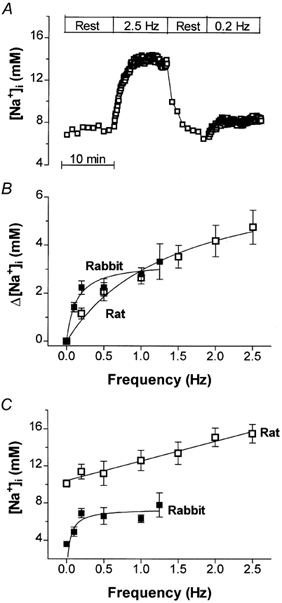
Figure 6. Frequency-dependent increase in [Na+]i upon field stimulation.

A, representative experiment in a rat cell. [Na+]i increased during the first 2–4 min of stimulation and then reached a plateau. When stimulation was stopped, [Na+]i returned to the resting level. B, frequency dependence of [Na+]i increase in rabbit and rat myocytes. A minimum of six cells were studied at each frequency. C, the actual values measured for [Na+]i at different frequencies.
