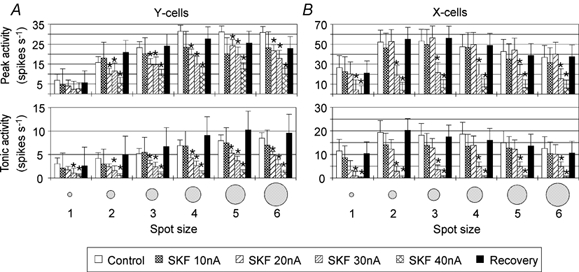
Figure 3. Dose-dependent effect of the D1 receptor agonist SKF on the peak and tonic responses of Y- and X-cells to spot stimuli of different sizes.

The bar histograms in A and B show mean (absolute) response levels and standard errors of the mean during control records, records with 10, 20, 30 and 40 nA SKF application and recoveries. The data are averaged from four Y-cells and five X-cells; otherwise the same conventions are used as in Fig. 2.
