
Figure 11. Response dynamics of X- and Y-cells during continuous QUIN application.
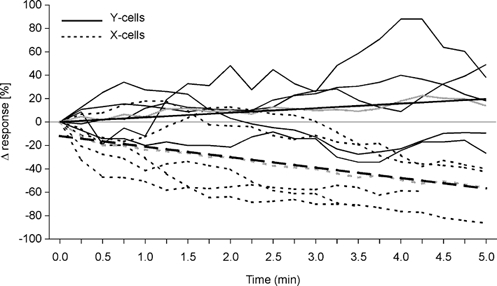
The mean tonic activity of five X- and five Y-cells is plotted over time after onset of QUIN application with 10–20 nA. The curves were slightly smoothed by calculating sliding means from three successive responses. The responses were normalized to the mean of the three first response levels, which were set to 0 on the graph. Continuous lines show Y-cell activity, dashed lines that for the X-cells. The grey lines show overall means for X- and Y-cells. Regression lines have also been added.