
Figure 3. MPD is preserved during slow depression induced by repetitive patterned stimulation.
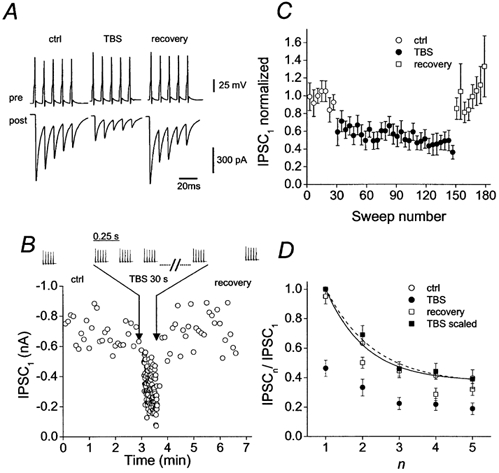
A, train of presynaptic action potentials evoked by brief current pulses (top traces) and corresponding average IPSCs (bottom traces) in control (ctrl), in the late phase of slow depression (TBS) and after recovery from slow depression (recovery). Average IPSCs were obtained from 30, 30 and 20 individual sweeps, respectively. B, plot of peak amplitude of first IPSC (IPSC1; single traces) against time. Traces show presynaptic action potentials, with TBS period indicated between arrows. Trains of action potentials (5 stimuli at 100 Hz) were applied at a frequency of 0.17 Hz or 0.2 Hz (ctrl and recovery) and 4 Hz (TBS). Data in A and B were from the same pair. C, plot of IPSC1 against sweep number. Each point represents the mean peak amplitude of 4 consecutive traces, averaged over ten pairs. D, mean ratio of IPSCn/IPSC1, plotted against the number within the train (n). Symbol code for C and D: ○, data in control; •, data during slow depression (last 30 sweeps of TBS period); □, data after recovery from slow depression (last 20 sweeps; all normalized to IPSC1 in control). ▪, data during slow depression (normalized to IPSC1 during slow depression). Curves represent exponential functions fitted to control data points (continuous; τ= 11 ms, offset 0.38) and data points during slow depression (dashed; τ= 13 ms, offset 0.36). Data from 10 pairs.