
Figure 1. Flow cytometry of NCU-2 and NCU-1 cells after incubation with anti-CD59 (dashed line), anti-MCP (dashed-dotted line) and anti-DAF (dotted line) antibodies.
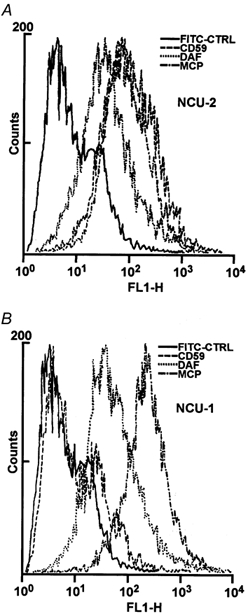
FACS analysis revealed the presence of complement regulatory molecules in the membrane of NCU-2 cells (A) whereas NCU-1 cells expressed DAF and MCP but not CD59 (B). The continuous line represents the FITC control.