
Figure 5. COX-1, COX-2, iNOS and β-actin mRNA expression in control (0 h), and 3 and 24 h after inflammation in the joint synovium of the rat analysed by RT-PCR.
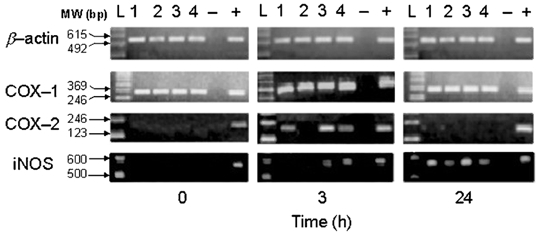
The PCR products from four rats (lanes 1–4) in each panel from the β-actin, COX-1, COX-2 and iNOS sequences generated after 35 cycles of amplification were analysed by electrophoresis in a 2 % TBE agarose gel. A 123 bp and 100 bp (iNOS) DNA ladder was used as a molecular weight standard. The sizes of the amplified DNA fragments are indicated in base pairs (see Table 1). -, negative control; +, positive control (see Methods).