
Figure 2. Changes in the shape and frequency of mEPSCs occur with increasing temperature.
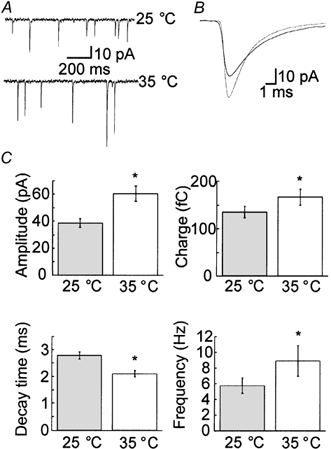
A, example traces of mEPSCs recorded in the presence of 200 nm TTX from the same cell at both 25 and 35 °C. B, superimposed traces of the average mEPSC from the same cell as shown in A at 25 (continuous line) and 35 °C (dotted line). C, statistical analysis indicated that the amplitude, charge and frequency of release increased significantly at the higher temperature (n = 13; Table 1). Furthermore, the decay time decreased significantly at the higher temperature (n = 13; Table 1). Asterisks indicate changes that were statistically significant (P < 0.05).