
Figure 4. The release probability decreases at the higher temperature.
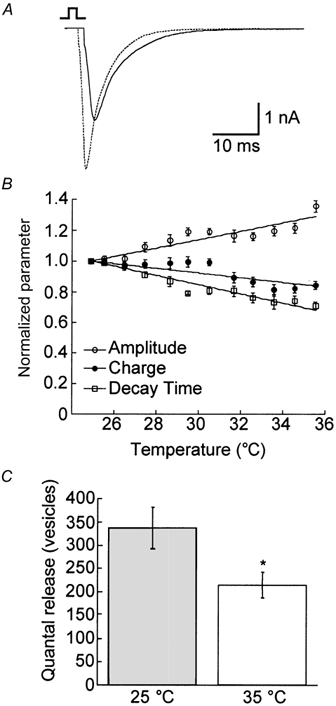
A, example traces of the EPSC from the same cell at both 25 (continuous line) and 35 °C (dotted line). B, plot of the instantaneous change in the EPSC amplitude (○), charge (•) and decay time (□) (n = 10). The amplitude increased significantly with increasing temperature, while the charge and decay time decreased significantly with increasing temperature (Table 1). C, by dividing the charge of the EPSC by the mean quantal charge at each temperature in the absence (n = 10) and presence (n = 11) of CTZ, we quantified the quanta released per EPSC. For both conditions, we observed a significant (* P < 0.05) decrease in the release probability at the higher temperature. We also observed a significant increase in the total number of quanta released at both temperatures in the presence of CTZ.