
Figure 6. Maintenance of synchronous release during high frequency stimulation is improved at the higher temperature.
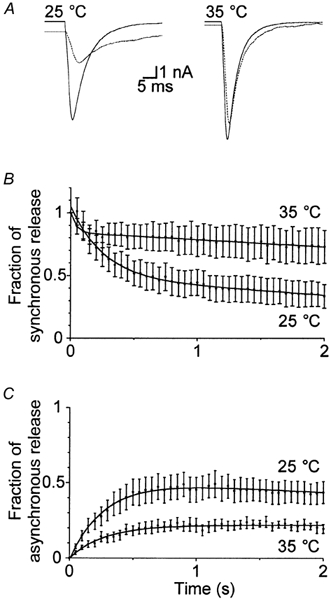
A, comparison of the response of the same cell at the start (continuous line) and end (after 5 s; dotted line) of 20 Hz stimulation at both temperatures. Interestingly, the increase in decay time of the EPSC and lowering of the baseline were not as pronounced at the higher temperature. The components of synchronous (B) and asynchronous (C) release were quantified as described in the Methods and plotted as a function of time for the first 2 s of stimulation at 20 Hz at both 25 and 35 °C (n = 10).