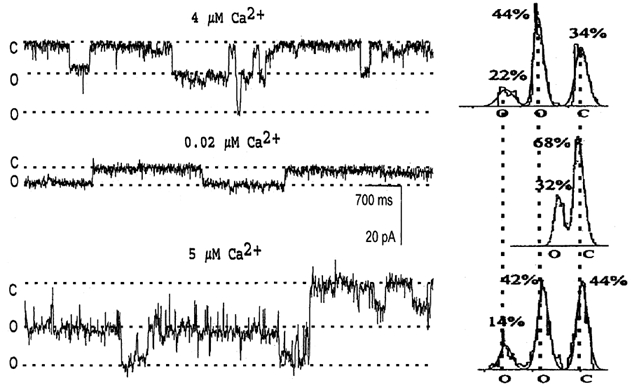
Figure 4. Ca2+ modulation of the NSG cation channel.

After the large conductance NSG cation channel was incorporated into a lipid bilayer, the Ca2+ concentration in cis solution was adjusted with EGTA (Lee et al. 1992). The holding potential was −10 mV for all traces. The cis solution contained 150 mm KCl and 10 mm Hepes, with indicated concentrations of free Ca2+, while the trans solution contained 50 mm KCl, 10 mm Hepes and 2 mm EGTA, both adjusted to pH 7.4. Channel currents were filtered at 200 Hz. Two open (o) and one closed (c) states are indicated on the left of each trace and under the appropriate peaks of the all-points amplitude histograms summarizing each condition, shown on the right. The top recording, in 4 μm Ca2+, shows that the NSG channel can open to either conductance level. After chelating the free Ca2+ to 0.02 μm, the larger conductance open state was eliminated, with channel openings only to the lower amplitude state, and the total open probability was reduced (middle trace). The conductance of the NSG channel was also decreased (by 41.2 %). After restoring the free Ca2+ to 5 μm, the open probability was increased and the larger conductance open state was recovered (bottom trace). The different open and closed state levels are indicated by dotted lines both in the recordings and in the histograms, as in Fig. 2. Corresponding currents: 0 pA for c, −9.42 pA for the first o state, and −16.76 pA for the second o state.
