
Figure 5. Effects of ADP on spontaneous Ca2+ release in the absence of PCr.
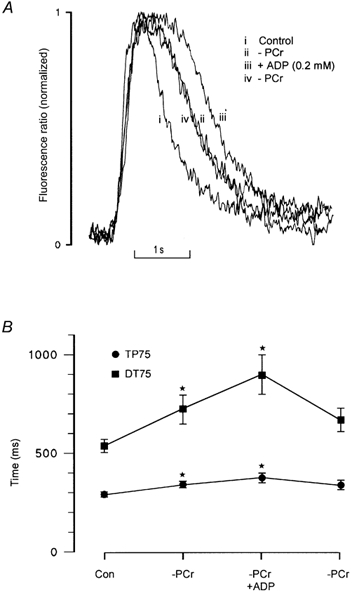
A, spontaneous Ca2+ transients are shown superimposed and normalized on an expanded time scale: (i) in the presence of 10 mm PCr; (ii) in the absence of PCr; (iii) in the absence of PCr, but with 0.2 mm ADP added; and (iv) following reintroduction of a solution lacking PCr (zero ADP). B, the accumulated data show that after withdrawal of PCr, addition of 0.2 mm ADP further increased TP75 by 10.4 ± 4.6 % (mean ± s.e.m., n = 6) and DT75 by 24.2 ± 5.2 % (mean ± s.e.m., n = 6; *P < 0.01) respectively.