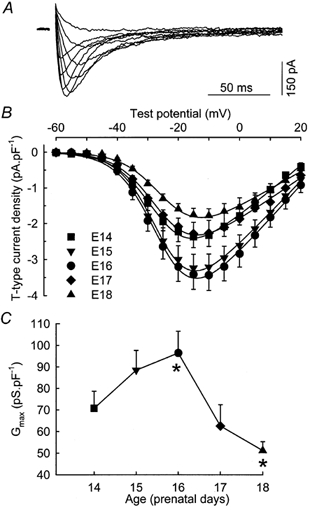
Figure 1. Voltage dependence of T-type Ca2+ current density during prenatal myogenesis.

A, superimposition of difference traces, in response to test pulses to −45, −40, −35, −30, −25, −15, −5, 5 and 15 mV. The cell was isolated from a fetus at E16 and had a capacitance of 187 pF. B, voltage dependence of the average density of T-type Ca2+ current recorded in myofibres from 14- (n = 13), 15- (n = 10), 16- (n = 15), 17- (n = 8) and 18-day-old (n = 8) fetuses. The curves correspond to a fit to the mean data at each age using eqn (1) from Methods. C, average maximum macroscopic conductance calculated from the I-V curve as described in Methods plotted versus the age of the fetuses. Asterisks indicate two values which are significantly different (ANOVA test, P < 0.05).
