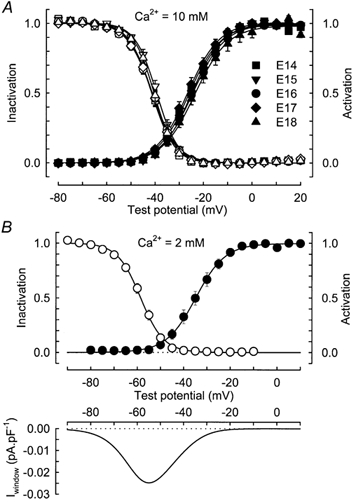
Figure 2. Properties of the T-type Ca2+ current during prenatal myogenesis.

A, voltage dependence of T-type Ca2+ current activation (filled symbols) and inactivation (open symbols) in myofibres from 14- (n = 13), 15- (n = 10), 16- (n = 15), 17- (n = 8) and 18-day-old (n = 8) fetuses in the presence of 10 mm external Ca2+. The data for the activation and inactivation in each cell were obtained as described in Methods and then averaged on this graph. Continuous lines correspond to a Boltzmann fit to the population average. B, top, same curves as in A but in the presence of 2 mm external Ca2+. The data were obtained from 9 cells at E16. Parameters of the fits are V1/2,ac=−34.8 mV, kac= 6.36 mV, V1/2,inac=−58.6 mV and kinac=−5.00 mV. Bottom, putative window current obtained by multiplying the predicted peak current-voltage curve by the predicted steady-state inactivation curve. The average window current reached a maximum of 0.025 pA pF−1 at a potential of −54.8 mV.
