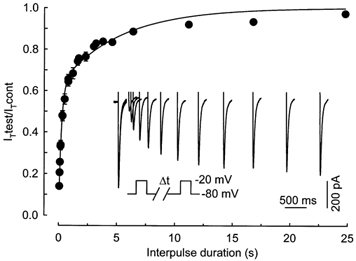
Figure 4. Time dependence of recovery from short-term inactivation.

Average plots (from 12 cells at E16) of the relative peak current elicited by the test pulse as a function of the interpulse duration. The relationship was fitted by a double exponential with a time constant of 224 ms for 63 % of the current and 5.16 s for the other 37 % of the current. Inset, superimposed current traces from the beginning of a typical experiment showing the increase of the current induced by the test pulse when the recovery interval grew longer. The time dependence of recovery was studied using a paired pulse protocol (see below the traces) applied every 60 s and where inactivation was induced by a 250 ms depolarization to −20 mV. Capacitance of the cell isolated from a 16-day-old fetus was 302 pF.
