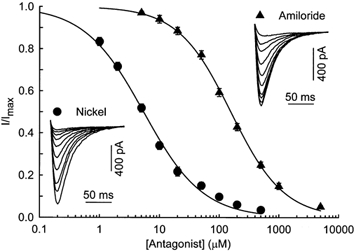
Figure 5. Effect of nickel ions and amiloride on T-type Ca2+ current.

Dose-response curve for the block of T-type Ca2+ current by the antagonist. Data represent the average (± s.e.m.) responses from 9 and 7 cells at E16, for NiCl2 and amiloride, respectively. The smooth curves represent the fit of the Hill equation to the data with IC50= 5.4 and 156 μm and nH= 0.88 and 0.98 for NiCl2 and amiloride, respectively. Insets, typical responses to increasing concentrations of NiCl2 and amiloride. Test pulses to −20 mV from a holding potential of −80 mV were delivered every 20 s. Traces shown here are control traces and current in presence of 1, 2, 5, 10, 20, 50, 100, 200 and 500 μm NiCl2 or 5, 10, 20, 50, 100, 200, 500, 1000 and 5000 μm amiloride. Capacitance of the cells isolated from 16-day-old fetuses was 152 and 109 pF, respectively.
