
Figure 5. Differentiating tonic neurons from phasic neurons.
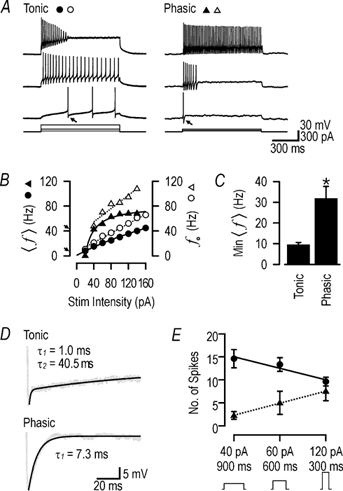
A, as shown in this example, a tonic cell (left traces) may fail to maintain firing in response to strong stimulation, whereas a phasic cell (right traces) can, on occasion, increase its duration of firing long enough to maintain firing until the end of the stimulus. This illustrates the necessity of testing with milder stimulus intensities, at which tonic cells maintain slow repetitive firing whereas phasic cells do not, to ensure proper classification according to the scheme presented here. B, the differences in membrane properties culminate in markedly different 〈f〉-I curves between tonic (•) and phasic (▴) cells. The difference in responsiveness to mild stimulation is well documented by the relative shapes of these curves; continuous lines show least squares fits with the generic equation Y = (1 + ax)/(b + cx). In particular, the minimum maintainable 〈f〉, indicated by arrows on the Y-axis, was noticeably different between this tonic and phasic cell (8 vs. 42 Hz). Despite the difference in convexity of the 〈f〉-I curves, the initial firing frequency, f0 (defined as reciprocal of the first ISI of the response) increased linearly with stimulus intensity for both tonic (○) and phasic (▵) cells; dotted lines show linear regressions. C, the minimum maintainable 〈f〉 was determined for each tonic and phasic cell as the 〈f〉 for the first response (i.e. to the lowest stimulus intensity) generating more than one action potential. This varied significantly between cell types (t test; *P < 0.001). Bars show means ±s.e.m.D, the differences in afterhyperpolarisation (AHP) kinetics are likely to contribute to the observed differences in repetitive spiking near rheobase and in the shape of the 〈f〉-I curves. Traces show enlarged view of AHPs indicated by arrows on A. The AHP in the tonic cell was best described by a double exponential function, whereas a single exponential function appropriately described the AHP in the phasic cell, where the slower component was missing (see Results). E, to test for differences in their integrative properties, cells were stimulated with the same total charge (36 fC) achieved either by a mild, prolonged stimulus or by a strong, brief stimulus. Tonic cells were optimally excited by the former pattern whereas phasic cells were optimally excited by the latter. Data show means ±s.e.m. for tonic (•) and phasic (▴) cells; slopes of regression lines were significantly different (t test; P < 0.005). Thus, the response of the neuron is affected by both stimulus intensity and duration.