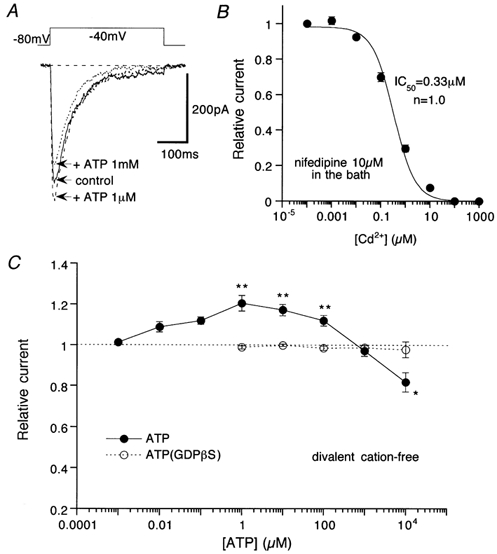
Figure 3. Concentration-dependent effects of ATP on ImVDCC with Na+ as the charge carrier (divalent cation-free conditions).

Nifedipine (10 μm) in the bath. A, actual traces of ImVDCC (leak-subtracted). Uppermost trace indicates the waveform of the step pulses used. B, Cd2+ concentration-inhibition curve for ImVDCC. • and bars represent means ±s.e.m. from 5 cells and the smooth continuous curve is the result of Hill fitting. C, relationship between ATP concentration and the ImVDCC amplitude. • and ○, mean of data pooled from 5–20 cells in the absence and presence of 500 μm GDPβS in the pipette, respectively. *P > 0.05 and **P > 0.01 with Student's unpaired t test for the ATP concentration data (• and ○).
