
Figure 6. Velocity imbalance, gain, and phase lead of the VOR after local administration of the indicated drugs in the PH nucleus.
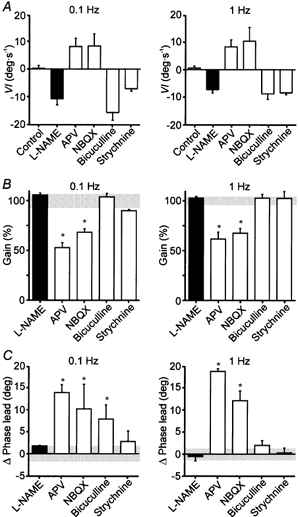
A, velocity imbalance (VI) during VOR induction by rotation of the head at 0.1 and 1 Hz. Positive values represent velocity imbalance toward the injected side and negative values toward the contralateral side. B, gain of the VOR induced by rotation of the head at 0.1 and 1 Hz after injection of the different drugs. Gain is expressed as percentage of the control value for each experiment. Grey horizontal bar, 100 % ± s.d. of control values. C, changes in phase lead during the VOR induced by rotation of the head at 0.1 and 1 Hz produced by injection of the different drugs. Values are expressed in degrees (deg). Grey horizontal bar, 0 ± s.d. of control values. Values are expressed as means ± s.e.m. *P < 0.05 compared with control values, using the non-parametric Mann-Whitney U test. n = 5 for l-NAME; n = 3 for the other drugs.