
Figure 3. Effect of intraduodenal glucose infusion at a rate of either 1 kcal min−1 (•) or 3 kcal min−1 (▵) on blood glucose (left) and plasma insulin (right) concentrations (absolute values).
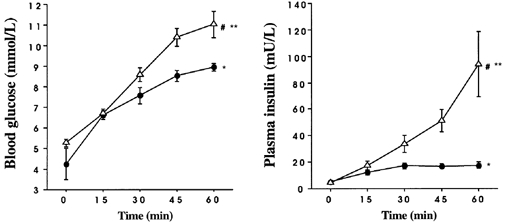
Data are means ±s.e.m. Significant differences: *change from baseline for 1 kcal min−1; ** change from baseline for 3 kcal min−1 and #3 kcal min−1vs. 1 kcal min−1 over time.