
Figure 6. Hypoxic ventilatory response (HVR).
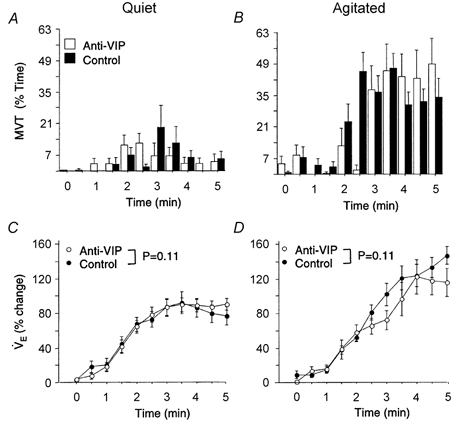
The effect of arousal on the HVR is shown by comparing MVT (A and B) and corresponding HVR (C and D) profiles of ‘quiet’ (sleep efficiency > 90 %) vs.‘agitated’ mice (sleep efficiency < 90 %). The plateau in HVR of quiet mice (coincident with the hypoxic nadir) suggests that sleep prevailed during these tests (C). Note the greater HVR of agitated mice (D). HVR profiles matched by sleep efficiency were comparable between groups (P = 0.11; ANOVA), indicating normal hypoxic responsiveness in anti-VIP mice.